What is PEAL*?
What is PEAL*?
PEAL is Linear’s patented and proprietary method for separating signals of interest from noise and performing identification. Peal offers the following advantages:
- It allows separation of signals and noise, including motion artifacts without the need for motion sensors filter aids like accelerometers
- It allows matching of signals of interest with a high degree of accuracy for identification and security applications
- It avoids many industry patents on sensor aided waveform extraction
- It does not damage waveforms like frequency based filters coupled to filter aid sensors
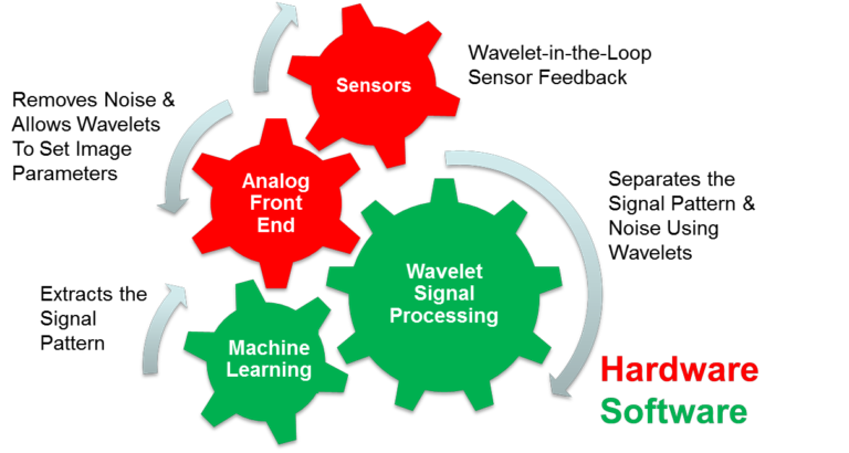
In the diagram above the gears represent the key elements of PEAL. Two of the gears are hardware gears. The first is the sensor which couples to an analog front end (AFE). This AFE is a very unique AFE which includes multiple stabilization loop and a special hardware interface which directly accepts wavelet feedback. We call it “wavelet-in-the-loop” and it is unique to Linear Dimensions. No other system but PEAL offers true hardware wavelet-in-the-loop feedback. The other two gears are software gears. The first is wavelet processing which separates noise and machine learning which recognizes and extracts the items of interest.
What can PEAL do for me?
PEAL allows you to utilize sensors in real world applications where noise, EMI, static and noise artifacts are a reality. A great example of the power of PEAL is the illustrated in the image below.
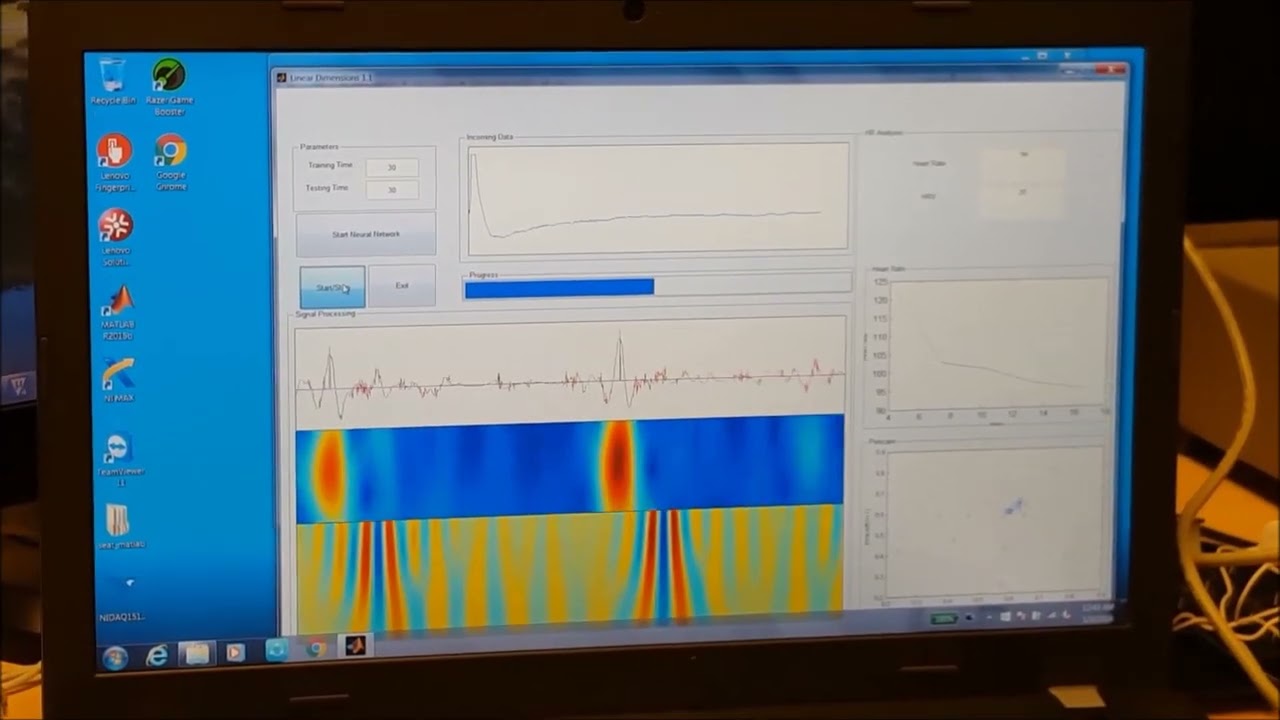
In this example our engineer is sitting on six copper cloth sensors coupled to a foam pad. The engineer is wearing a shirt, however, in other tests subjects have worn undershirt, shirt and sweater. The system has been taught to recognize heart beats (ECG) and to adapt to the user. Initially, the machine learning system will struggle to recognize all beats but will quickly adapt and recognize all of the beats. In the image a vertical blue line is drawn through recognized beats. The system utilizes multiple wavelet breakdowns to identify beats – two are shown streaming with the identified reconstructed waveform to illustrate what the system is “seeing.” A Poincare plot shows recognize beats with some outliers from before adaption has occurred. Similarly, heart rate is calculated and is initially calculated high until the PEAL system adapts. Note that no other method was able to extract ECG from these type of sensors because they are extremely sensitive to distance, static, noise and couple significant EMI like an antenna. This example illustrates the power of PEAL and will be an eye opener to anyone who has tried to extract capacitive information.
What is a Wavelet?
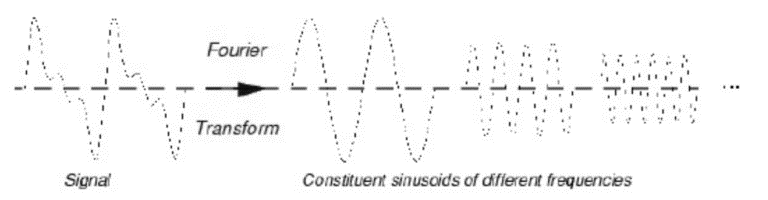
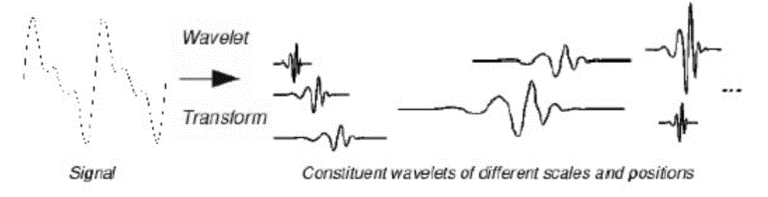
Wavelet’s are a branch of mathematics similar to fourier analysis. The figure on the left illustrates the concept of the fourier transform where the signal on the left can be broken down into a sum of waveforms of different frequency and amplitude. On the right the same signal is broken down by wavelets. Wavelets are mathematically rigorous waveforms similar to those shown on the right which can be used to deconstruct and reconstruct a signal with the same level of rigor as fourier.
Wavelets can be used to create images by shifting them across a signal of interest. In the above image the amplitude and frequency are increased and shifted across the signal of interest. As the waveform is shifted a coefficient indicating the relative match is recorded. If the wavelet has a signficant match the number is higher. Otherwise it is lower. For example in the plot above on the left the Low Scale wavelet would have a much lower coefficient of match than the high scale on the right.
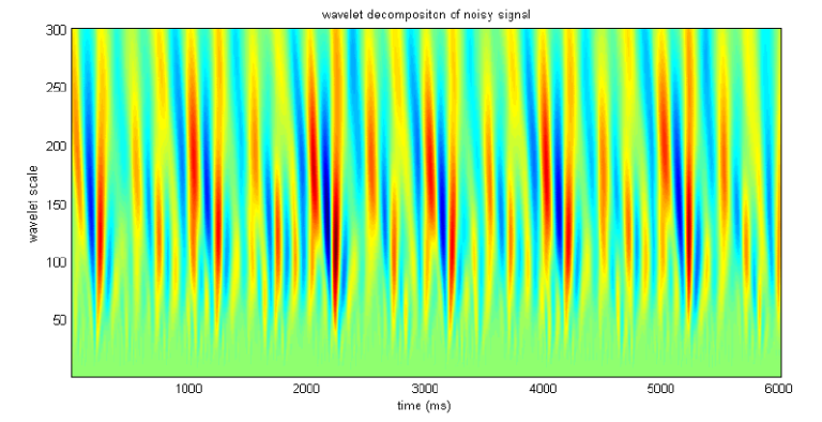
The image above is an example of a wavelet decomposition shown graphically. The plot can be thought of as a three dimensional breakdown of the signal being analyzed with time on the x-axis, scale on the y-axis and color as coefficient of match.
How do Wavelets contrast to other Methods?
Most engineers are used to coupling sensors to an analog front end (AFE) and producing results. If you go to your doctor and have your ECG taken your doctor will apply a gel to electrodes and ask you to stay extremely still. After some time the sensors will match the potential of your body and catch the small sub 1mV ECG signal. In many applications, however, we cannot ask the user to stay still or rely on gels or tight coupling. In these cases a method must be found to extract the signal from noise, static, EMI and motion artifacts. For optical wearable devices for example the biggest problem was removing motion artifacts. This is typically solved by utilizing a frequency based filter to remove most of the information, and then utilize a motion sensor like an accelerometer to try to subtract the noise. The problem is that after the frequency based filtering there is a lot of information lost. Normally, a bandpass filter, a 50 or 60 Hz notch filter, and other filters are used to try to extract some portion of the signal. Thereafter a guess is made as to the amplitude of the motion signal to subtract. This guess is never very exact and the original signal is lost. Heart rate or simple information may be extracted but not more complex information.
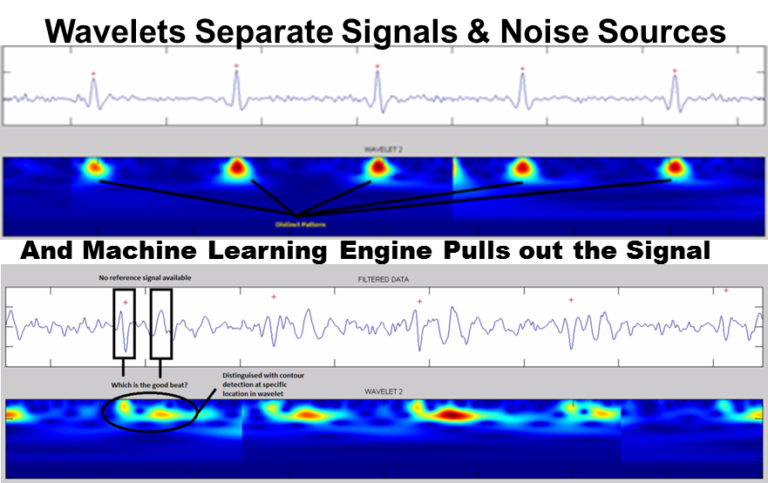
Where the ECG is clear even in the “raw” signal in the upper waveform, in the real world signal there is no way to recognize the heart beats with the eye in the incoming data. The motion, noise, EMI and static completely obscure the signal of interest such that many different artifacts could be heart beats. The boxes illustrate a good example where either pulse could be a heart beat if normal methods were used. The lower image, however, indicates the same waveform viewed by PEAL. It can be seen that the frequency-time signature of a heart beat produces the “genie lamp” shape. Linear’s machine learning engine can learn to recognize these shapes and therefore extract the information very accurately. The blue shadow areas around the “genie lamp” are the noise artifacts separated from the signal of interest. By extracting and reversing the “genie lamps” the original ECG can be extracted. At the same time the “genie lamp” characteristic of each persons heart waveform are 7.5x more accurate than a capacitive fingerprint sensor for identification.